
Re:infer uses machine learning models to identify patterns in communications data like emails, chats and calls. Models extrapolate these patterns to make predictions for similar data in the future, driving downstream processes like automations and analytics.
For this approach to work, the data used to train a model needs to be representative of the communications it will make predictions on. When this is not the case, models will make mistakes that can seriously impact the performance of systems which rely on accurate predictions.
To help users build robust, well-performing models, we built a tool to ensure data used for training always matches the user’s target task. In this blog post we discuss how this tool works, and some of the problems we tackled during its development.
The labelling bias problem
What is labelling bias?
Models in Re:infer are trained on user-reviewed data. Users create labels for topics they care about, then annotate examples with labels that apply. A model is then automatically trained on this reviewed data to predict which labels apply.
Annotating data is difficult and time consuming. Re:infer leverages active learning to speed up the process, helping users annotate the most informative data points in the fastest time possible.
Since active learning selects specific data points, it tends to focus only on a subset of the underlying data. Furthermore, switching between concepts comes with a cognitive overhead. Users are encouraged to label groups of examples from similar topics at the same time, rather than constantly changing between themes.
This can lead to some topics appearing more or less frequently in the reviewed data than the dataset as a whole. We call this labelling bias, because the data labelled by users no longer represents the underlying data.


Why should you care?
Re:infer uses reviewed data during validation to assess model performance. If this data is biased towards certain topics, the validation results can be misleading.
Consider a shared mailbox for a multinational bank which contains emails from across EMEA. Re:infer’s multilingual models can understand communications data in a mix of languages. However, if a user were to only label emails from a single language, the model may learn to focus on features specific to that language.
In this case, validation scores would be good for that model, as it performs well on all the annotated examples. On the other hand, performance on emails in other languages may be worse. The user would be unaware because there are no examples to highlight this in the reviewed data. This could lead to inefficiencies in any processes which rely on the model for accurate predictions.
For those more mathematically inclined, Re:infer estimates . Using Bayes’ rule, we can break this down into:
Each of these components is estimated from some or all of the dataset during training.
- Models the range of documents for a given topic. The model learns to estimate this from the annotated data, extrapolating using its knowledge of language and the world.
- Models the different types of documents in the dataset and their relative frequencies. This is independent of labels and can be estimated from all examples (both reviewed and unreviewed).
- Models the frequency of different topics. This can only be estimated from the annotated data, as it is specific to each use-case.
All three parts are required to find . However, both and depend heavily on the annotated data. When labelling bias is present, these estimates may not match the true distributions, leading to inaccuracies in .
Detecting labelling bias
Given the vital role that reviewed data plays in training and validating models, we need to detect labelling bias and warn users when their data isn’t representative.
At the simplest level, labelling bias is a discrepancy between examples which have been reviewed by users and those which have not. Imagine a person is asked to check for labelling bias in a dataset. This person might look at common themes which appear in the reviewed data and then check how often these occur in the unreviewed data.
If the person finds a reliable rule for differentiating between these two groups we can be confident that there is an imbalance. On the other hand, in a dataset with no labelling bias a person would be unable to accurately predict if examples are reviewed or not. The predictive performance of this person measures how much labelling bias is present in the dataset.
We used this idea as a starting point for our labelling bias model.
Building a labelling bias model
The comparison task can be automated with a machine learning model. This model is different to Re:infer’s core model, which predicts which labels or entities apply to a document. Instead, the model is trained to identify reviewed data points.
The validation scores for the model show how easily the model can distinguish between reviewed and unreviewed examples, and therefore how much labelling bias is present in the dataset.
Classifying reviewed examples
A simple classifier model trained on the synthetic dataset has an average precision of over 80%. If the dataset was unbiased, we would expect the model to perform no better than random chance, which matches the bias we can see in the reviewed data.


Similar naive classifier models trained on real datasets could also reliably detect reviewed examples. This suggests that labelling bias was present in these datasets, but the exact source was unknown.
For the synthetic dataset, it’s easy to see the effect of labelling bias in the plotted data. This is not the case for a real dataset, where data lies in more than 2 dimensions and patterns are often much more complex.
Instead, we can look for patterns in examples that the model is confident are unreviewed. This approach showed that emails confidently predicted as being unreviewed often contained attachments with no text. Where these emails were present in the data, they were usually underrepresented in the reviewed examples.
This constitutes a clear labelling bias and shows the promise of a classifier model.
Detecting meaningful bias
The labelling bias model is trained to distinguish between reviewed and unreviewed data. In this setting, the model tries to catch out the user by identifying patterns in their labelled data. This adversarial approach is a powerful way of inspecting the reviewed data, but also raises two interesting problems.
Trivial differences
Differences in reviewed and unreviewed data picked up by the model should have meaning to users. However, when we provided the naive bias model with detailed inputs, we found the model sometimes focussed on insignificant patterns.
For example, in one dataset attachment-only emails containing .jpg files with
GOCR in the name were confidently predicted as being unreviewed. There were no
such examples in the reviewed set, but 160 in the unreviewed set, representing a
small labelling bias.
This combination of features wasn’t significant to the user. No downstream
processes depended on the presence of GOCR in filenames, and these examples
were just a subset of attachment-only emails in the dataset. In fact, all of
these emails had confident, correct predictions for the dataset’s
Auto-Generated label, meaning these features also had no significance to
Re:infer’s labelling model either. However, the bias model was using these
features to make predictions.
Users shouldn’t have to label all combinations of meaningless features to get a good labelling bias score. For almost all concepts, we don’t need thousands of examples to fully capture the range of possible data points. Instead, the labelling bias model should only focus on differences which actually impact labelling predictions.
Unimportant topics
Datasets may contain data points which are never annotated by users because they are irrelevant for their target task.
Returning to our multinational banking example, teams could use Re:infer to drive country-specific use cases. Each team would build a model customised to their target task, with all models using emails from the shared mailbox.
These use cases are likely to differ between teams. European countries may wish to track the effect of Brexit on their operations and would create a set of labels for this purpose. On the other hand, teams in the Middle East and Africa may have no use for Brexit-related emails and would ignore them in their model.
Not labelling Brexit-related emails is an example of labelling bias. However, this is a bias that is unimportant to users in the Middle East and Africa. The bias model should take this into account and only search for labelling bias in emails that the team deems useful.
Using labels as a signal
We need to make it more difficult for the labeller to focus on small features, but guide this by what the user defines as useful. To do this, we can alter the inputs we pass to our labelling bias model.
Our core labelling model doesn't work directly with text. Instead, we use a language model to convert communications data into model inputs (known as embedding). These inputs contain the useful information present in the data, but in a form that the model can interpret.
The inputs to our core labelling model contain a large amount of information from the input text. This allows the model to learn complex relationships which influence label predictions. However, for the labelling bias model, this also lets the model focus on small, meaningless differences in features like filenames.
Dimensionality reduction is a way of filtering out information while maintaining meaningful properties of the original inputs. Using reduced inputs prevents the bias model from focusing on small features while retaining information that is important in a dataset.
Users only create labels for topics they want to track, so including labels during dimensionality reduction means we keep the most important input features. With this approach, our labelling bias model no longer focuses on small features and takes labels into account when estimating bias.


Labelling bias in Re:infer
We use our labelling bias model for two main tasks in Re:infer.
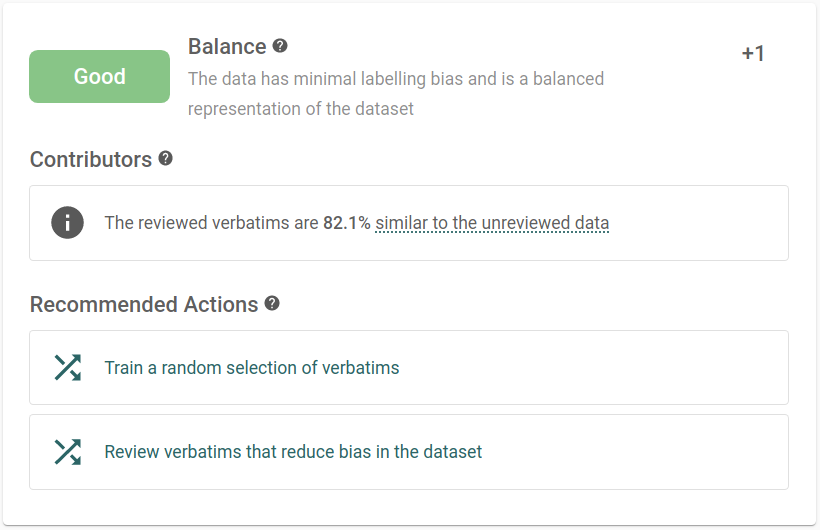
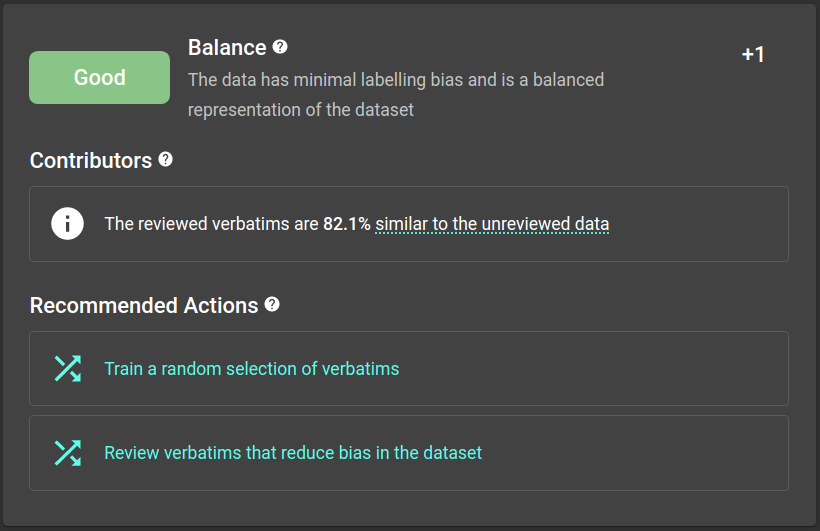
Balance scores
Detecting and addressing labelling bias is vital for reliable model validation scores. Because of this, we show the performance of the labelling bias model in the model rating.
This is in the form of a similarity measure between the reviewed and unreviewed data. A low similarity score indicates a big difference between reviewed and unreviewed data, highlighting labelling bias in the dataset.
Rebalance
The best way to build an unbiased set of reviewed data is to annotate a random selection of examples. This way, the reviewed labels will always match the underlying distribution. However, annotating in this way is inefficient, especially for rare concepts.
Instead, Re:infer uses active learning to speed up the labelling process by targeting the most useful examples. These targeted examples do not always match the underlying data distribution, meaning labelling biases can gradually develop over time.
Active learning is not guaranteed to produce an unbiased set of reviewed examples. However, when labelling bias is detected, we can use the labelling bias model to address any imbalance. This way, we benefit from the reduced training time of active learning and the low labelling bias of random sampling.
This is the basis for our Rebalance view, which shows data points that the
bias model is confident are unreviewed, and therefore underrepresented in the
dataset. Annotating these examples provides a quick way of addressing labelling
bias in a dataset.
Balanced active learning
To demonstrate how rebalance improves Re:infer's performance, we simulated users annotating examples following three active learning strategies.
- Random. Annotate a random selection of the unreviewed examples.
- Standard. Annotate examples that Re:infer is most unsure of, or those with
the highest prediction entropy. This is a common approach to active learning,
and is equivalent to only using the
Teachview in Re:infer. - Re:infer. Follow Re:infer’s active learning strategy, which suggests the
top training actions for improving the current model. This includes the
Rebalanceview.
We ran these simulations on the open-source Reuters dataset provided by NLTK which contains news articles tagged with one or more of 90 labels. For each run, the same randomly selected initial set of 100 examples was used. For each simulation step, we model users annotating 50 examples selected by the active learning strategy. Re:infer then retrains and the process is repeated.
The plot below shows the performance of Re:infer’s labelling model on the Reuters task as more examples are annotated. The balance score is also shown, representing the amount of labelling bias present in the dataset.


Following the standard active learning strategy, we get similar mean average precision to Re:infer, with random sampling scoring lowest of the three strategies. However, standard active learning also leads to significant labelling bias, meaning validation results for this approach may be misleading.
Re:infer’s active learning strategy produces similar balance scores to random
sampling, but requires fewer examples to produce the same model performance.
This means active learning with Rebalance gives the best of both standard
active learning and random sampling: unbiased reviewed examples and good model
performance in less time.
Summary
- To get accurate model validation scores, annotated data must be representative of the dataset as a whole.
- Re:infer’s labelling bias model compares reviewed and unreviewed data to spot topics that are underrepresented in the dataset.
- The
Rebalanceview can be used to quickly address labelling bias in a dataset. - Re:infer's active learning leads to less labelling bias than standard approaches, and performs better than random sampling alone.